
Venture Capital Overhang: $118 Billion
This past week, the Alliance of Merger and Acquisition Advisors and research firm Pitchbook Data released a report which indicates private equity firms in the U.S. are sitting on $400 billion in overhang – the difference between fundraising commitments and invested capital. The figure is essentially the “dry powder” or uninvested capital private equity firms have at their disposal. The data was covered in a number of places over the past week, but VentureBeat writer Anthony Ha pointed out that the data does not include venture capital... so I decided to do some of my own research. Below is the chart I came up with for venture capital, using the same methodology the Pitchbook Data report uses (data from PwC, Thompson Reuters and the NVCA):
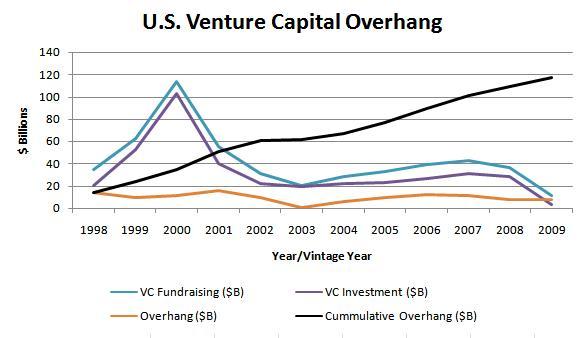 Source: PwC, NVCA, Thompson Reuters
Over the past decade, venture capital firms in the U.S. have amassed $118 billion in overhang. Of course the data is not perfect; you’d have to account for management fees, recycling of capital, etc. But it does tell us that venture capitalists are sitting on plenty of uninvested capital. Only in 2003 did the ammount of venture investment come close to equaling the amount of capital raised, and the average overhang per year is $10 billion.
The $118 billion figure isn’t too surprising. It’s pretty well known in the venture industry that lack of capital is not a major issue, in fact there might be too much capital chasing too few good deals. Also this year we’ve seen venture capitalists pull back sharply on investment amid economic uncertainly, deciding that focusing their attention on better managing and growing existing investments was a better use of time. We’re also seeing deal sizes come down as the cost of starting technology companies continues to drop. These factors explain the $118 billion and perhaps it’s being reflected in the recent slowdown in fundraising.
 AV
AV
Reader Comments (2)
I'm curious where you got your fundraising data. I pulled Thomson data straigth from NVCA and it is clear that an overhang is flat. If you account for the ~20% of dollars going into a VC firm that go towards mgmt fees, the overhang is dropping at a fairly rapid clip and sits at only around $15-$20B today
Hi Grant,
Only now saw your comment... the overhang figure is highly subjective and I don't think anyone except maybe a Cambridge Associates could accurately gauge how much uncalled capital is out there (the true overhang). As a proxy I (and other publications) use the differences in reported fundraising data and and investment data. Unfortunately, as I mention in my post this is nowhere near perfect. Part of the issue is what the NVCA reports for fundraising data - often they go back and add to or subtract from the figures, I'm guessing as funds are backfilled into their database and more data is available. Another thing they do is report the fundraising total in two ways, one is the amount raised by funds in that period, and the other is the amount raised to date (for example a vintage year 2007 fund may well raise capital in 2008 as well). I figured the amount raised number is probably more accurate (it was also a much larger figure) and therefore I got a larger overhang figure. Looking at venture industry data is alway tricky and as opposed to absolute figures its probably much more meaningful to focus on relative data, and look at, for example, changes in the overhang figure instead. I'll probably retool how I write about the overhang from now on so that its focuses more on recent times and looks at trends instead. I believe your figure is pretty accurate if you look at the fundraising data that's reporting on the NVCA website (the gross raised in each period).